SnappyData Monitoring Console
SnappyData Monitoring Console is a dashboard that provides a real-time view into cluster members, member logs, resource usage, running Jobs, SQL queries along with performance data. This simple widget based view allows you to navigate easily, visualize, and monitor your cluster. You can monitor the overall status of the cluster as well as the status of each member in the cluster. All the usage details are automatically refreshed after every five seconds.
Note
TIBCO ComputeDB Monitoring Console is not yet tested and supported on Internet Explorer.
To access SnappyData Monitoring Console, start your cluster and open http:<leadhost>:5050/dashboard/ in the web browser.
Note
<leadhost> is the hostname or IP of the lead node in your cluster which is provided in the conf/leads file.
The following topics are covered in this section:
Note
When connecting to a SnappyData cluster using Smart Connector, the information related to SQL, Jobs, and Stages are NOT displayed, as the Jobs and queries are primarily executed in your client Spark cluster. You can find this information on the Spark UI console of your client cluster. Read more about SnappyData Smart Connector Mode here.
In cases where you cannot access the SnappyData Monitoring Console to analyse Jobs and tasks, you must turn on the Spark History server.
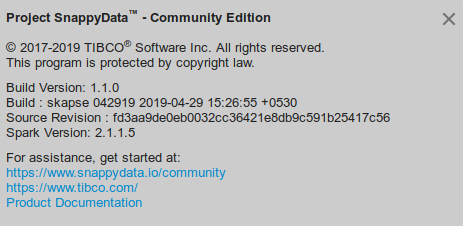
On the top-right side of the SnappyData Monitoring Console page, you can view the version details of SnappyData Snapshot. When you click this, the name and version of the product, the build details, the source revision details and the version number of the underlying spark are displayed.
On the top of the dashboard, the date and time details about when the cluster is started are displayed. The period till when the cluster is running is also shown.
Dashboard
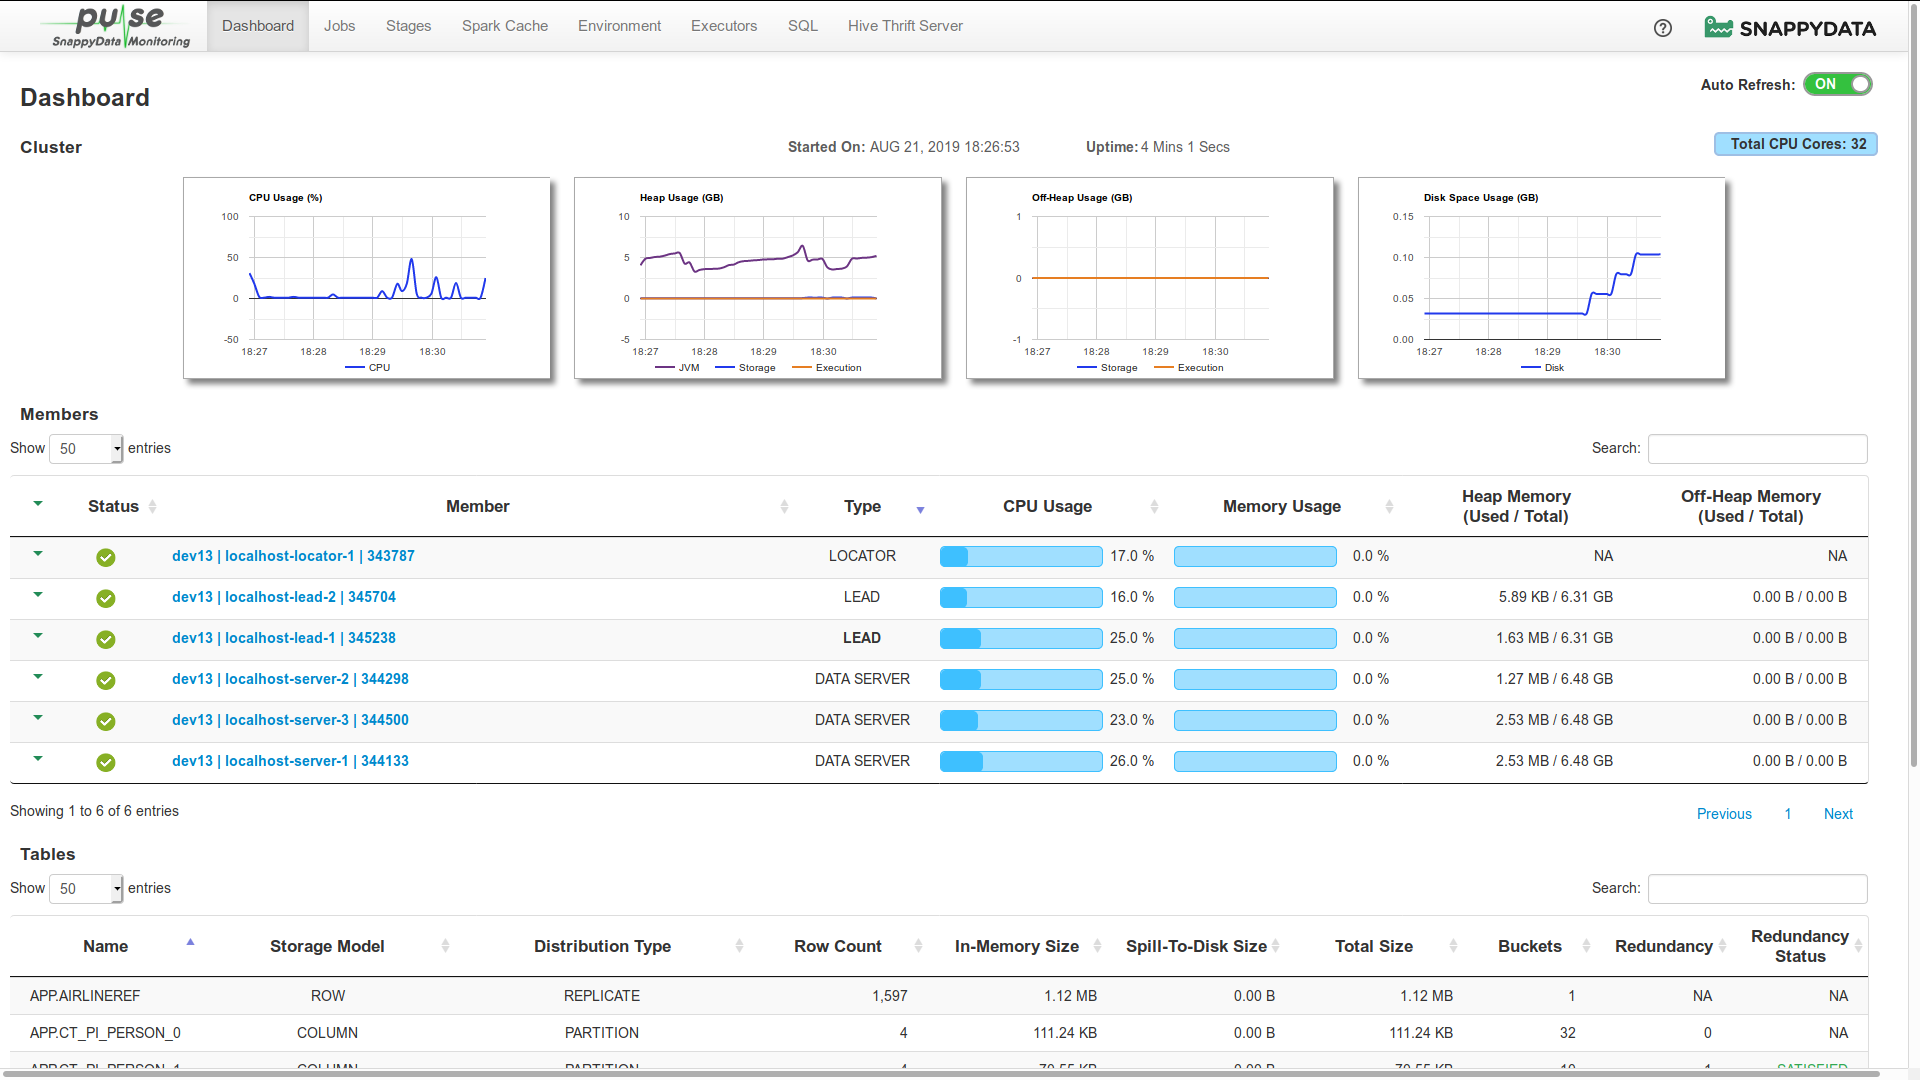
The Dashboard page graphically presents various cluster-level statistics that can be used to monitor the current health status of a cluster. The statistics on the dashboard page can be set to update automatically after every five seconds. If you want to turn off the auto-refresh, use the Auto Refresh switch that is provided on the upper-right corner.

The Dashboard page displays the following sections:
You can use the search and sort functionalities in any of the sections, except for the Cluster section. Sorting is enabled to sort items in an ascending and descending order. Further, you can also set the number of items that must be listed in each of these sections.
Cluster
In the Cluster section, you can view the following graphs which are automatically refreshed:
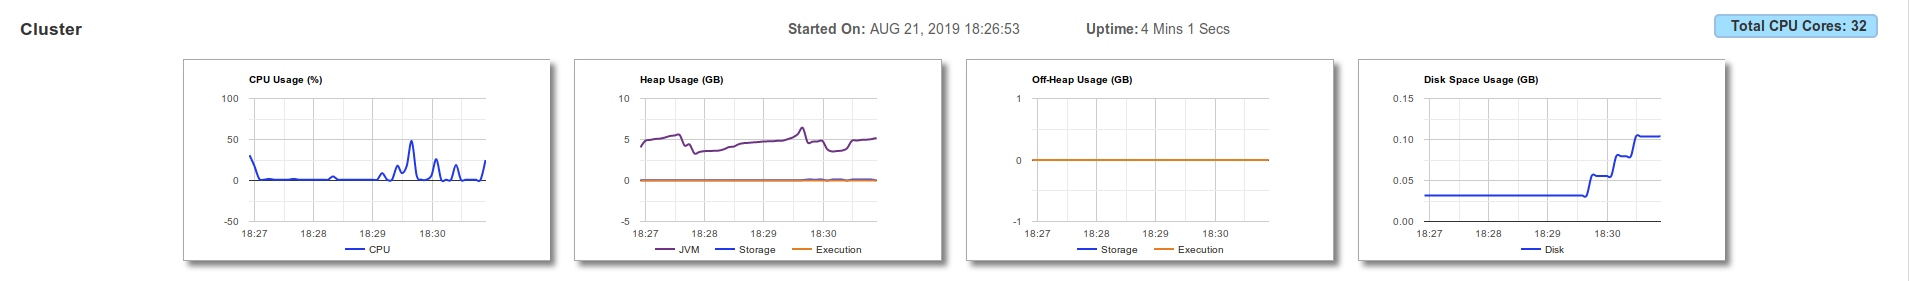
On the Dashboard page, the Cluster section displays the date and time when the cluster was launched. It also displays the cluster's up-time since cluster was launched.
You can view the total number of physical CPU cores present in your cluster on the top-right side of the page.

| Graphs | Description |
|---|---|
| CPU Usage | Graphically presents the trend of CPU utilization by all the nodes in the cluster for the last 15 minutes. The utilization is represented in percentage value. |
| Heap Usage | Graphically presents the collective utilization of Heap Memory by all the nodes in the cluster. This graph displays three trend lines which corresponds to the utilization of Heap Memory for the following:
|
| Off-Heap Usage | Graphically presents the collective utilization of Off-Heap Memory by all the nodes in the cluster. This graph displays two trend lines which corresponds to the utilization of Off-Heap Memory for the following:
|
| Disk Space | Graphically presents the collective utilization of disk space memory by all the nodes in the cluster. |
Members
In the Members section, you can view, in a tabular format, the details of each locator, data server, and lead member within a cluster. The details are automatically refreshed after every five seconds.
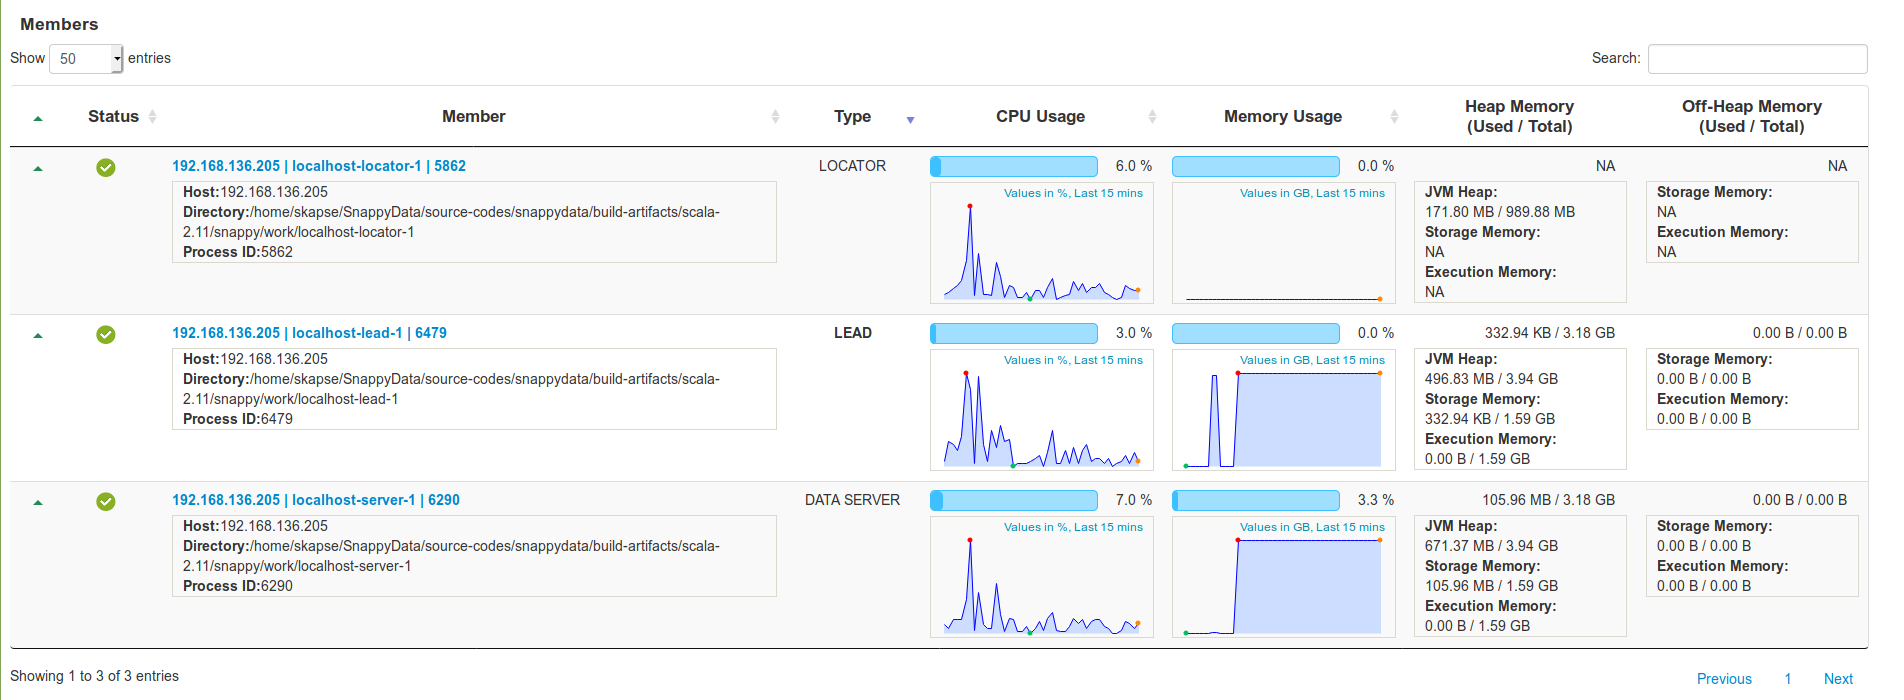
This table provides member details in the following columns:
| Column | Description |
|---|---|
| Status | Displays the status of the members, which can be either Running or Stopped. |
| Member | Displays a brief description of the member. Click the link in the column to view the Member Details where the usage trends and statistics of the members are shown along with the Member Logs. Click the drop-down arrow to find information such as the IP address of the host, the current working directory, and the Process ID number. |
| Type | Displays the type of the member. The type can be LEAD, LOCATOR, or DATA SERVER. The name of the active lead member is displayed in bold letters. |
| CPU Usage | Displays the CPU utilized by the member's host and it's trend over last 15 mins. |
| Memory Usage | Displays the collective Heap and Off-Heap memory utilization of a cluster member and it's trend over last 15 mins. |
| Heap Memory | Displays the member's utilized Heap memory versus total Heap memory. Click the down arrow in this column to view the detailed distribution of the member's Heap Memory for storage, execution, and JVM. |
| Off-Heap Memory | Displays the member's used Off-Heap memory and total Off-Heap memory. Click the down arrow in this column to view the detailed distribution of the member's Off-Heap memory for storage and execution. |
| Status | Description |
|---|---|
 |
Member is running. |
 |
Member has stopped or is unavailable. |
Tables
The Tables section lists all the tables in the cluster along with their corresponding statistical details. All these details are automatically refreshed after every five seconds.
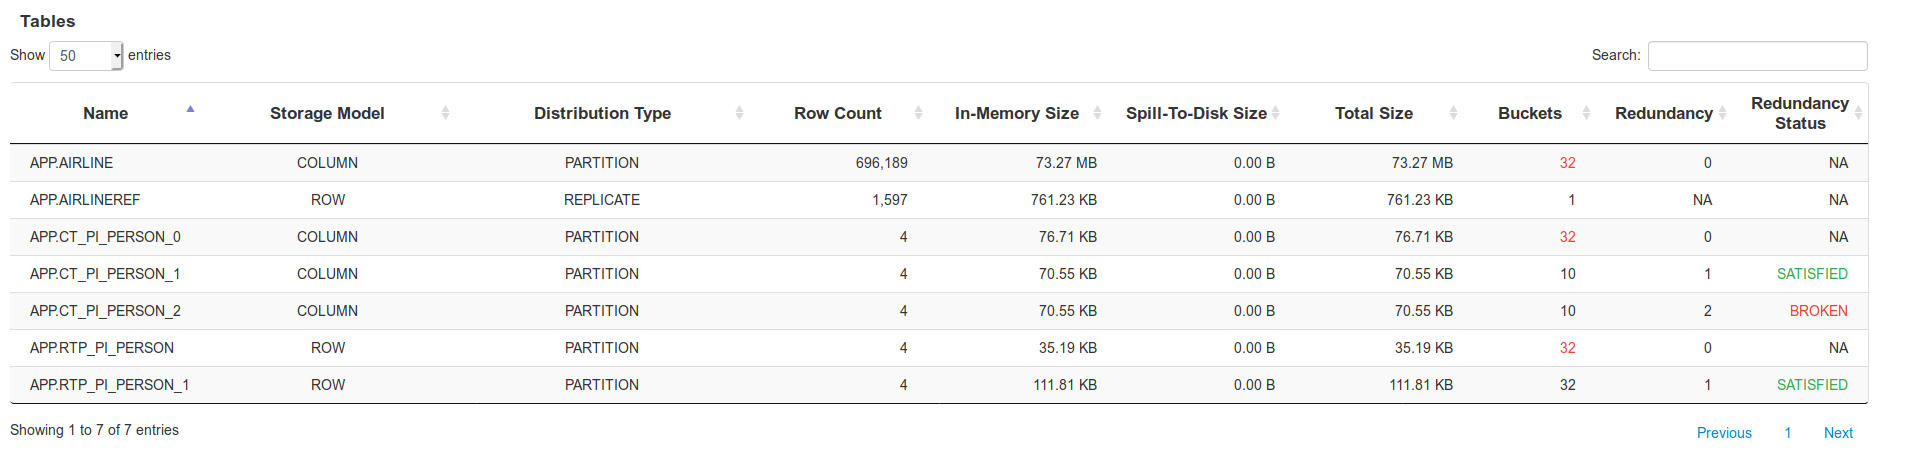
The following columns are displayed in this section:
| Column | Description |
|---|---|
| Name | Displays the name of the data table. |
| Storage Model | Displays the data storage model of the data table. Possible models are ROW and COLUMN. |
| Distribution Type | Displays the data distribution type for the table. Possible values are:
|
| Row Count | Displays the row count, which is the number of records present in the data table. |
| In-Memory Size | Displays the heap memory used by data table to store its data. If less than Total Size then the data is overflowing to disk. |
| Spill-to-Disk Size | Displays size of data overflown to disk |
| Total Size | Displays the collective physical memory and disk overflow space used by the data table to store its data. |
| Buckets | Displays the total number of buckets in the data table. If a number displayed in red here, it indicates that some of the buckets are offline. |
| Redundancy | Displays the number of redundant copies. Redundancy value 0 indicates that redundant copies are not configured. Redundancy value 1 indicates that one redundant copy is configured. Redundancy value NA indicates that redundancy is not applicable. |
| Redundancy Status | Displays whether redundancy criteria is satisfied or broken. Redundancy status Satisfied indicates that all the configured redundant copies are available. Redundancy status Broken indicates that some of the redundant copies are not available. Redundancy status NA indicates that redundancy is not applicable. |
External Tables
The External Tables section lists all the external tables present in the cluster along with their various statistical details. The displayed details are automatically refreshed after every five seconds.
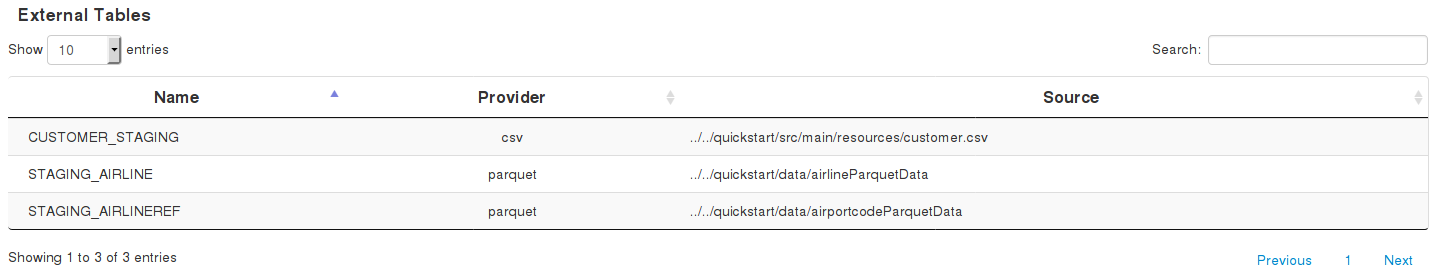
The following columns are displayed in this section:
| Column | Description |
|---|---|
| Name | Displays the name of the external table. |
| Provider | Displays the data store provider that is used when the external table was created. For example, Parquet, CSV, JDBC, etc. |
| Source | For Parquet and CSV format, the path of the data file used to create the external table is displayed. For JDBC, the name of the client driver is displayed. |
Member Details
The Member Details view shows the usage trend and statistics of a specific cluster member. To check the Member Details view, go to the Members section and click the link in the Member column. Here you can also view the Member Logs generated for a cluster member. The usage trends and the statistics of a specific member are auto updated periodically after every five seconds. If you want to turn off the auto-refresh, use the Auto Refresh switch that is provided on the upper-right corner. You can view, on demand, the latest logs by clicking on the Load New button provided at the bottom of the logs. You can also click the Load More button to view the older logs.
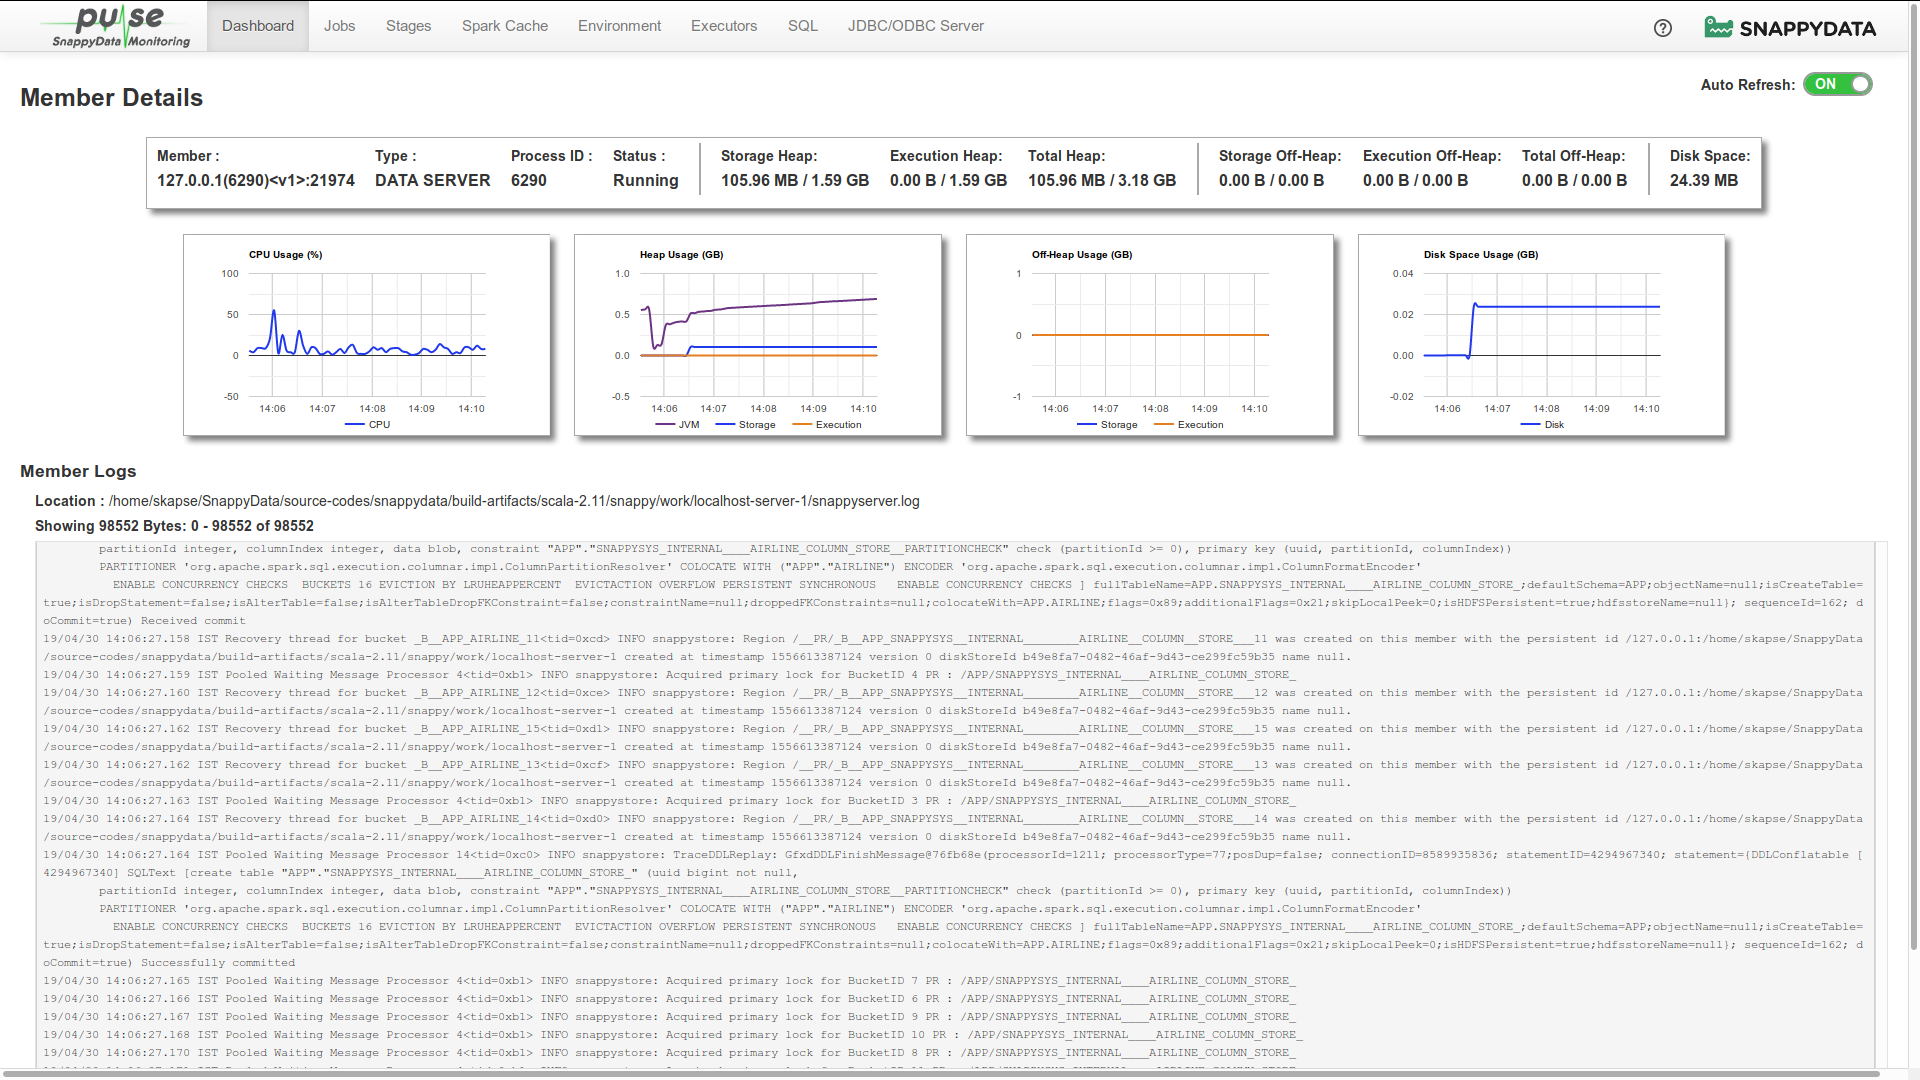
Member Statistics
The following member specific statistics are displayed:
| Item | Description |
|---|---|
| Member Name/ID | Displays the name or ID of the member. |
| Type | Displays the type of member, which can be LEAD, LOCATOR or DATA SERVER. |
| Process ID | Displays the process ID of the member. |
| Status | Displays the status of the member. This can be either Running or Unavailable |
| Heap Memory | Displays the total available heap memory, used heap memory, their distribution into heap storage, heap execution memory and their utilization. |
| Off-Heap Memory Usage | Displays the members total off-heap memory, used off-heap memory, their distribution into off-heap storage and off-heap execution memory, and their utilization. |
The usage trends of the member are represented in the following graphs:
| Graphs | Description |
|---|---|
| CPU Usage | Graphically presents the trend of CPU utilization by the member host for the last 15 minutes. The utilization is represented in percentage value. |
| Heap Usage | Graphically presents the utilization of Heap Memory by the member host. This graph displays three trend lines which corresponds to the utilization of Heap Memory for the following:
|
| Off-Heap Usage | Graphically presents the utilization of Off-Heap Memory by the member host. This graph displays two trend lines which corresponds to the utilization of Off-Heap Memory for the following:
|
| Disk Space | Graphically presents the utilization of disk space memory by the member host. |
Member Logs
In the Member Details page, you can view the logs generated for a single member in the cluster.
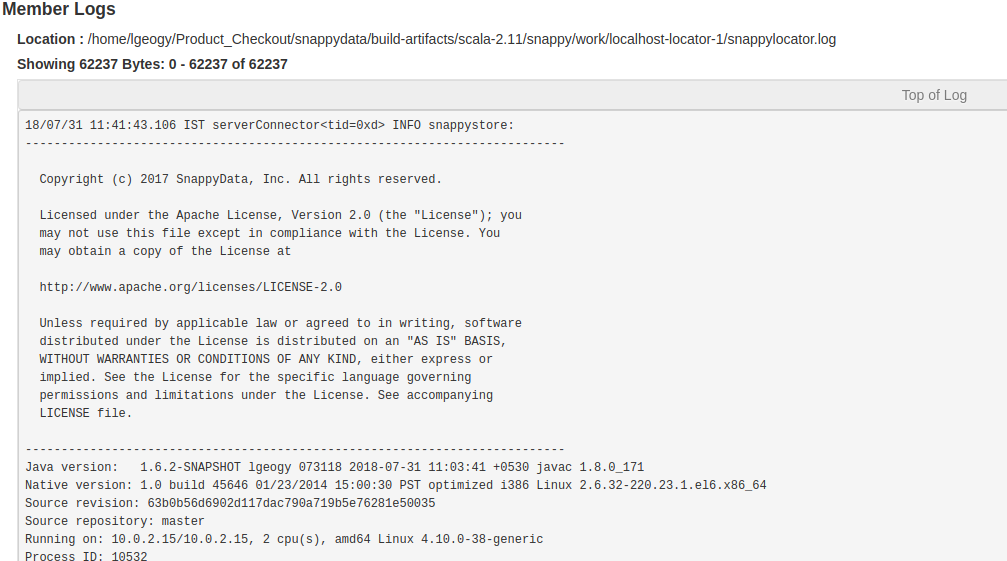
The following details are included:
| Item | Description |
|---|---|
| Log File Location | Displays the absolute path of the member's primary log file, which is on the host where the current member's processes are running. |
| Log Details | Displays details of the loaded logs such as Loaded Bytes, Start and End Indexes of Loaded Bytes, and Total Bytes of logs content. |
| Logs | Displays the actual log entries from the log files. It also displays the following buttons:
|
SQL
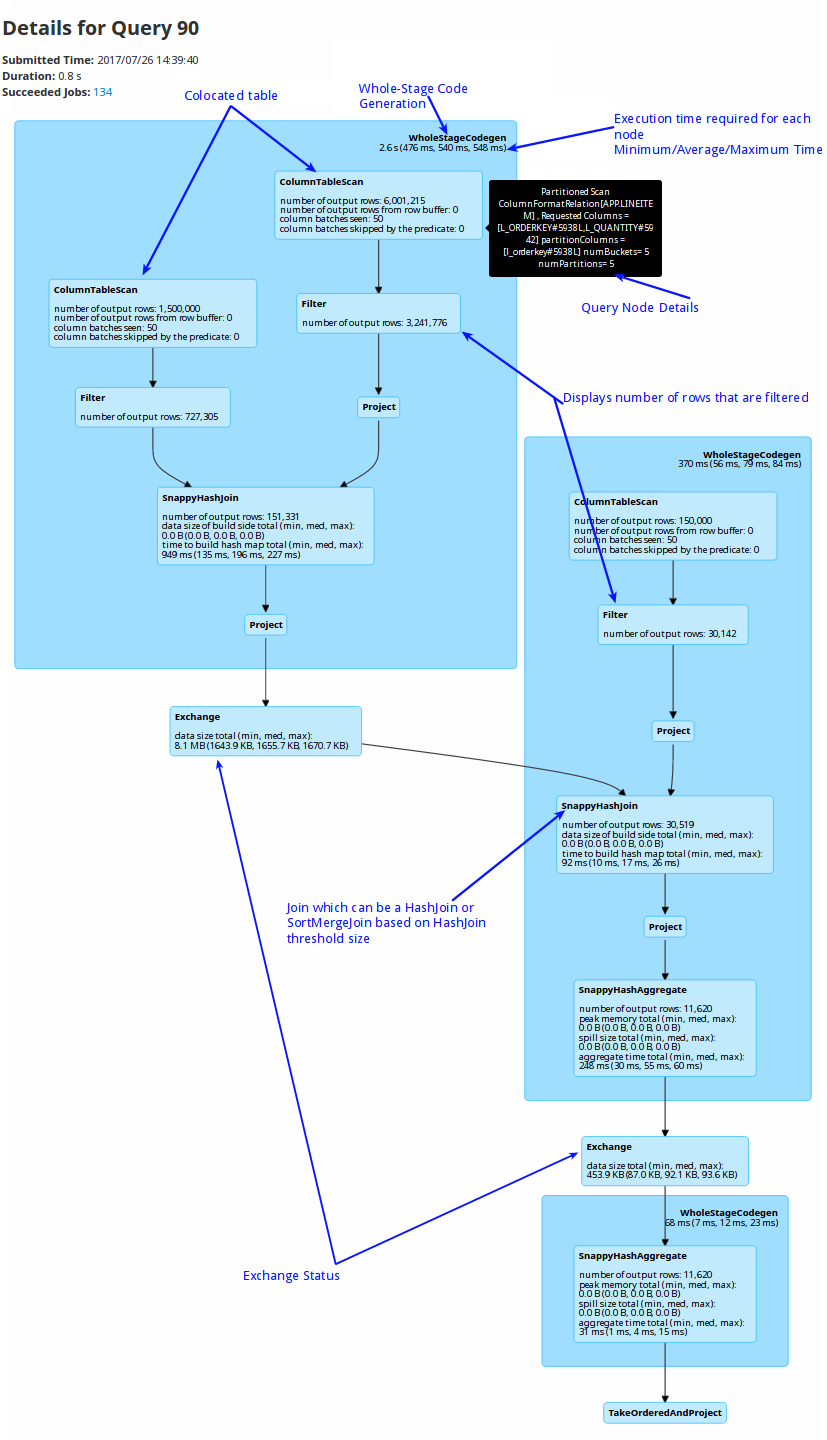
The SQL section shows all the queries and their corresponding details along with their execution plans and stagewise breakups.
| Item | Description |
|---|---|
| Colocated | When colocated tables are joined on the partitioning columns, the join happens locally on the node where data is present, without the need of shuffling the data. This improves the performance of the query significantly instead of broadcasting the data across all the data partitions. |
| Whole-Stage Code Generation | A whole stage code generation node compiles a sub-tree of plans that support code generation together into a single Java function, which helps improve execution performance. |
| Per node execution timing | Displays the time required for the execution of each node. If there are too many rows that are not getting filtered or exchanged. |
| Pool Name | Default/Low Latency. Applications can explicitly configure the use of this pool using a SQL command set snappydata.scheduler.pool=lowlatency. |
| Query Node Details | Hover over a component to view its details. |
| Filter | Displays the number of rows that are filtered for each node. |
| Joins | If HashJoin puts pressure on memory, you can change the HashJoin size to use SortMergeJoin to avoid on-heap memory pressure. |
Spark Cache
Spark Cache is the inbuilt storage mechanism of Spark. When you do a dataSet.cache(), it uses this storage to store the dataset's data in a columnar format. This storage can be configured to be one of the following:
- MEMORY_ONLY,
- MEMORY_AND_DISK,
- MEMORY_ONLY_SER,
- MEMORY_AND_DISK_SER,
- DISK_ONLY,
- MEMORY_ONLY_2,
- MEMORY_AND_DISK_2
For more details, see RDD Persistence section.
Environment
The Environment page provides detailed configurations for Spark environment including JVM, SparkContext, and SparkSession.
Executors
Executors are the entities that perform the tasks within a Spark job. Each Spark job is divided into multiple stages which can have one or more tasks depending on the number of partitions to be processed. All these tasks are scheduled on executor nodes which actually run them.
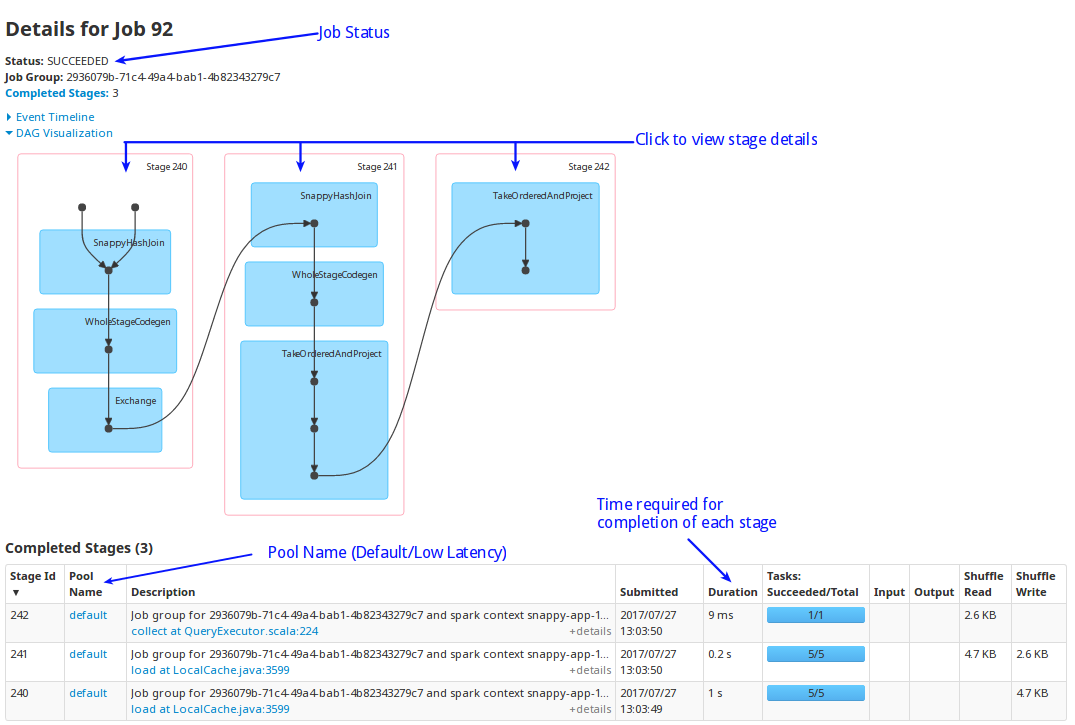
Jobs
The Jobs page lists all the Spark jobs. Each Spark action is translated as a Spark job. A job encapsulates the whole execution of an API or SQL. For example, dataSet.count() triggers a job.
-
Status: Displays the status of the job.
-
Stages: Click on the stage to view its details. The table displays the time taken for the completion of each stage.
Tip
You can cancel a long running job, using the Kill option. 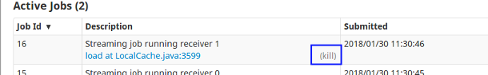
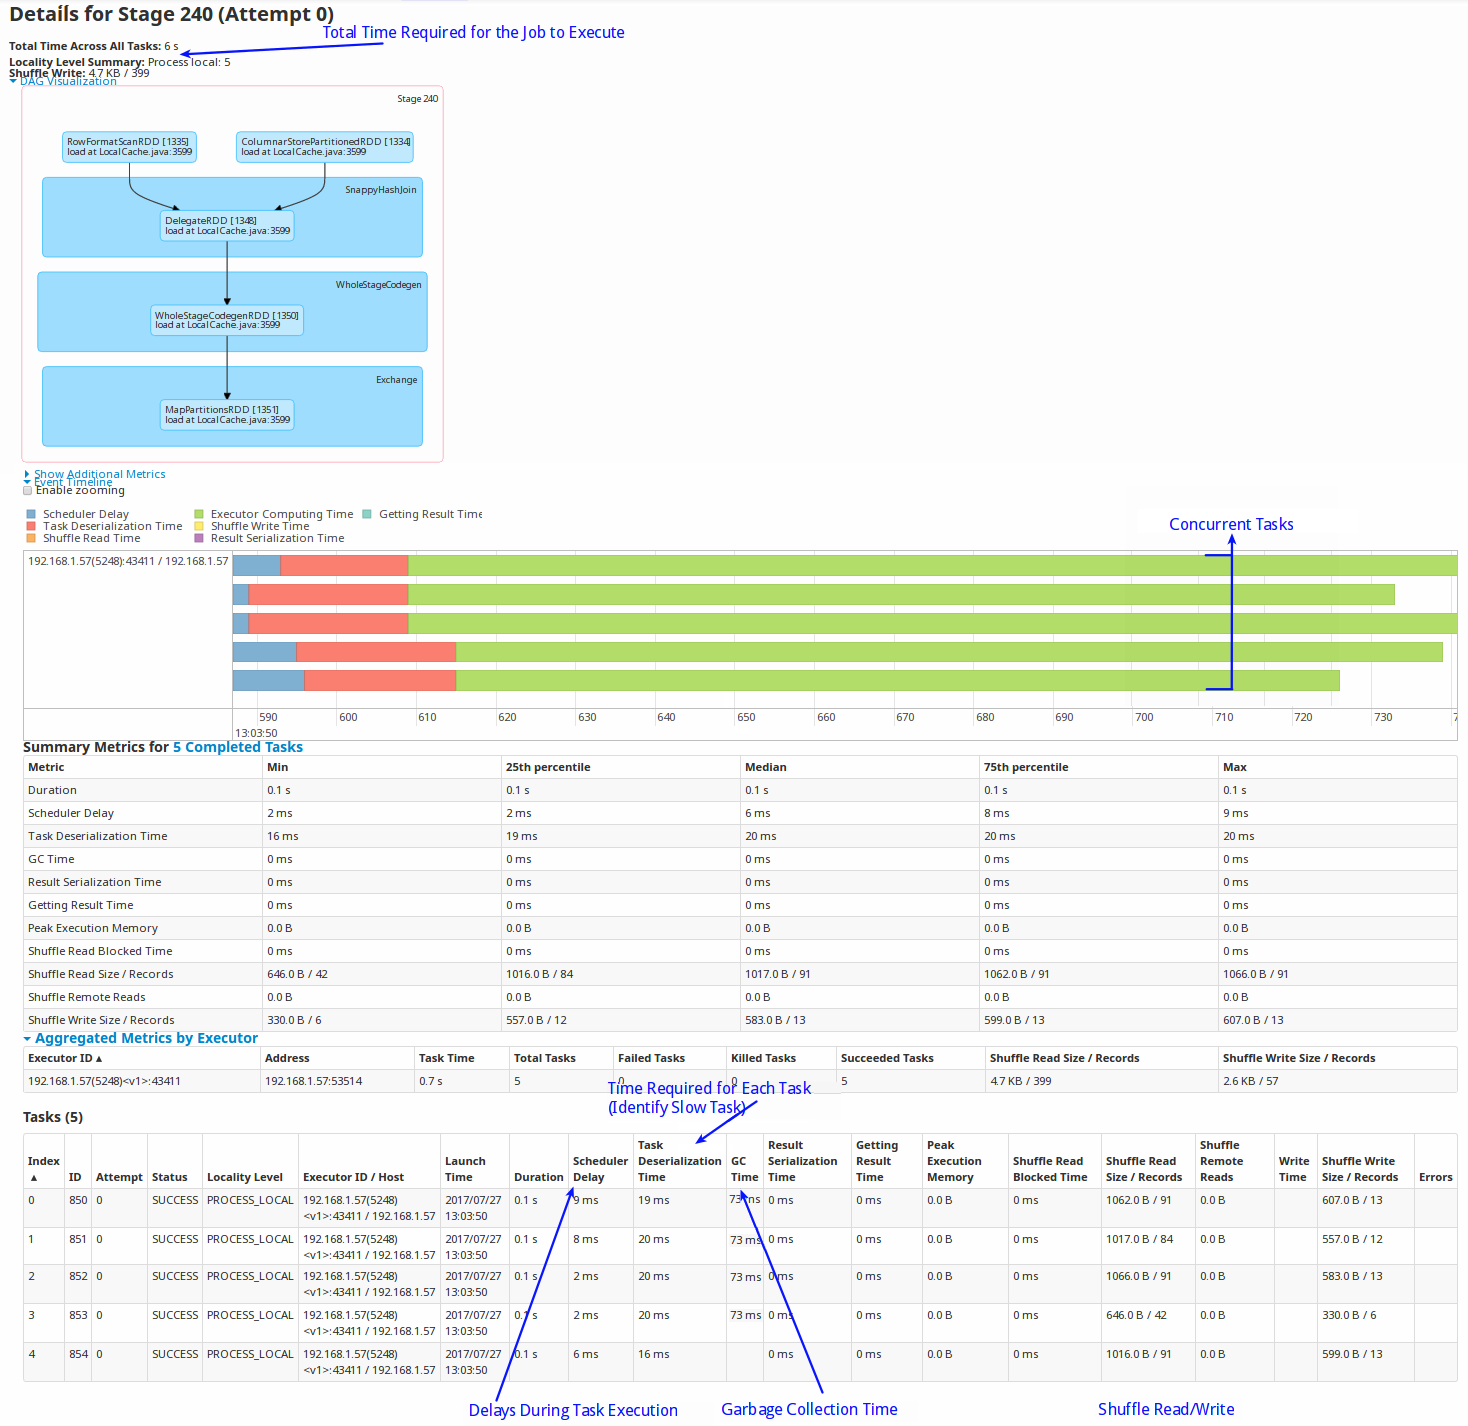
Stages
The Stages page displays the stage details of a Spark Job. Each Spark job is segregated into one or more stages. Each stage is an execution boundary where data exchange between nodes is required.
On this page, you can view the total time required for all the tasks in a job to complete. You can also view if any of the tasks got delayed for completion. This may occur in case of uneven data distribution.
-
Scheduler Delay indicates the waiting period for the task. Delays can be caused if there are too many concurrent jobs.
-
Shuffle reads and writes: Shuffles are written to disk and can take a lot of time to write and read. This can be avoided by using colocated and replicated tables. You can use high-performance SSD drives for temporary storage (spark.local.dir) to improve shuffle time.
-
Number of parallel tasks: Due to concurrency, multiple queries may take cores and a specific query can take longer. To fix this, you can create a new scheduler and assign appropriate cores to it.
-
GC time: Occasionally, on-heap object creation can slow down a query because of garbage collection. In these cases, it is recommended that you increase the on-heap memory, especially when you have row tables.
Spark History Server
The Spark History server is an HTTP server that let you analyze the Spark jobs.
The first step in tuning query performance in SnappyData is to understand the query physical plan that is available through the SQL tab on the SnappyData Monitoring console. The detailed execution plan requires one to understand the jobs and tasks associated with the query. This is available in the Jobs/Tasks tab. However, if the SnappyData Monitoring console is not accessible to the investigator, it becomes a difficult exercise. To overcome this, TIBCO recommends to turn on the History server for production applications.
To turn on the History server, do the following:
- Ensure to provide a shared disk that can be accessed from all the SnappyData nodes. If you do not have the NFS access, use HDFS. Provide the permissions to access a shared folder when you start SnappyData.
-
Enable event logging for the Spark jobs. For example, if the server was configured with a log directory of hdfs://namenode/shared/spark-logs, then configure the following properties in the conf/lead:
spark.eventLog.enabled true spark.eventLog.dir hdfs://namenode/shared/spark-logs -
Start the History server. ./sbin/start-history-server.sh This creates a web interface at http://
:18080 by default, listing incomplete and completed instances of SQL queries and the associated Spark jobs and tasks. For more details about History server, refer to Configuring History Server.